Blog 7 min read
OPC UA Subscriptions in Laravel: Build a Live Machine Dashboard
Build a live machine dashboard in Laravel with OPC UA subscriptions: a session-manager daemon streams PLC values into cache while Livewire keeps the UI fresh.

Gianfrancesco Aurecchia
@GianfriAur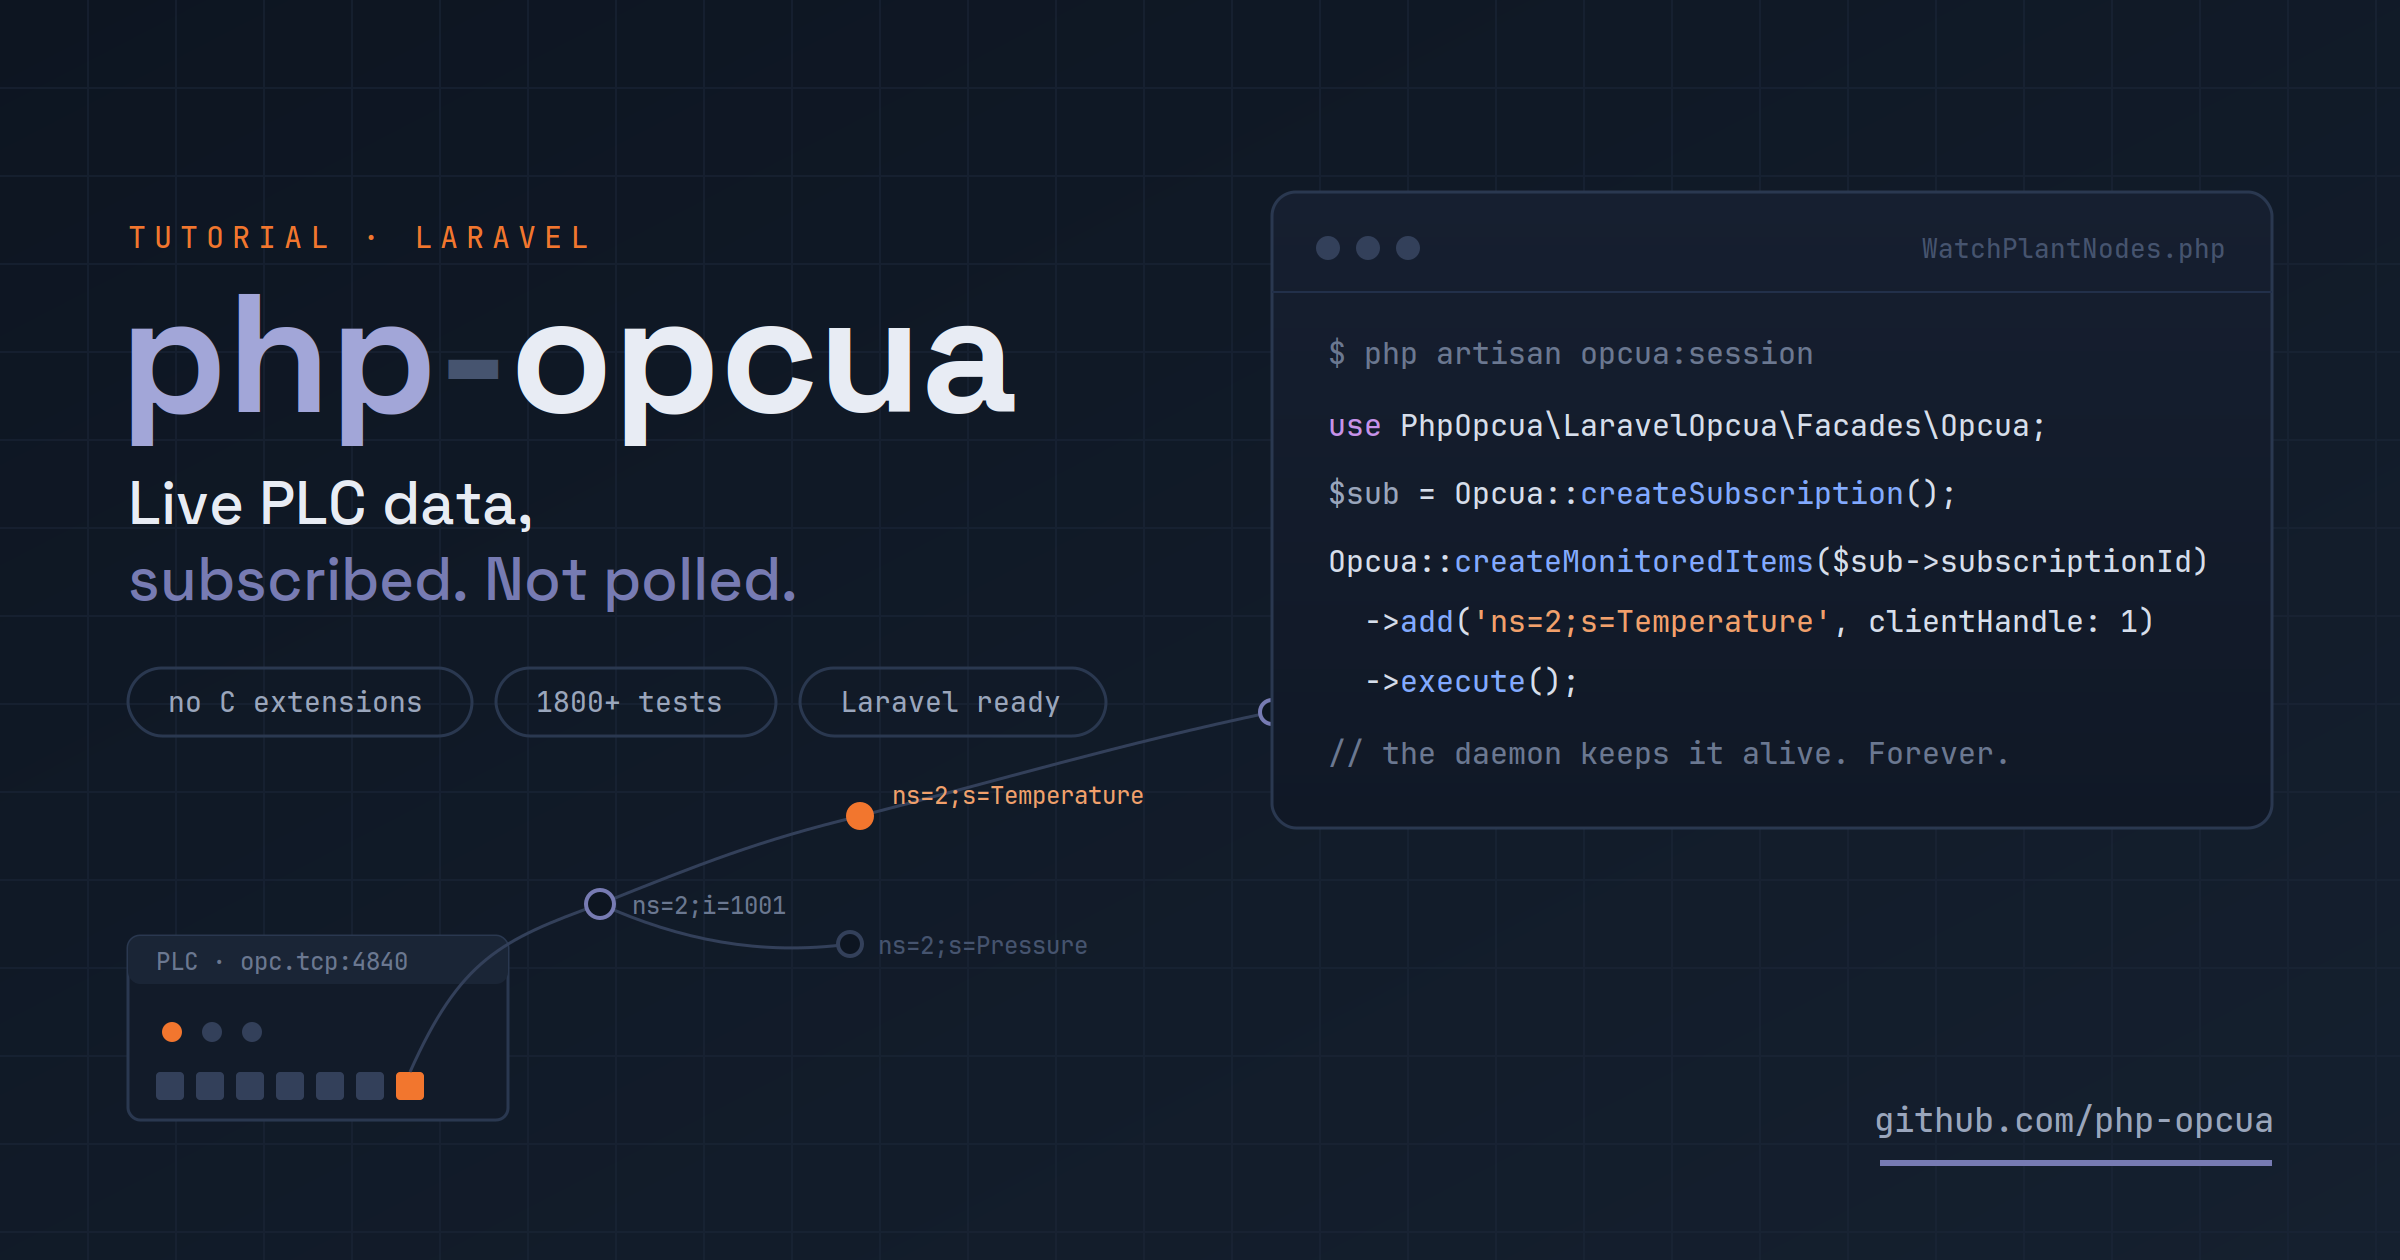
In the introduction to php-opcua we read a single value from a PLC. Useful, but a single read answers yesterday's question. What a plant manager actually wants is a screen on the wall: current temperature, line pressure, machine state — live, and built with the framework your team already knows.
That's what we're building today: a Laravel dashboard fed by OPC UA subscriptions, where the PLC pushes changes to us instead of us polling the PLC.
TL;DR
Create the subscription once; the opcua:session daemon keeps it alive and drives the publish loop. Every change arrives as a DataChangeReceived Laravel event; a listener caches it; Livewire polls the cache. Web requests never touch the PLC. About 80 lines end to end.
What we're building
A single page showing three live values from a production line: temperature, pressure and machine state. When the PLC value changes, the dashboard follows within a second.
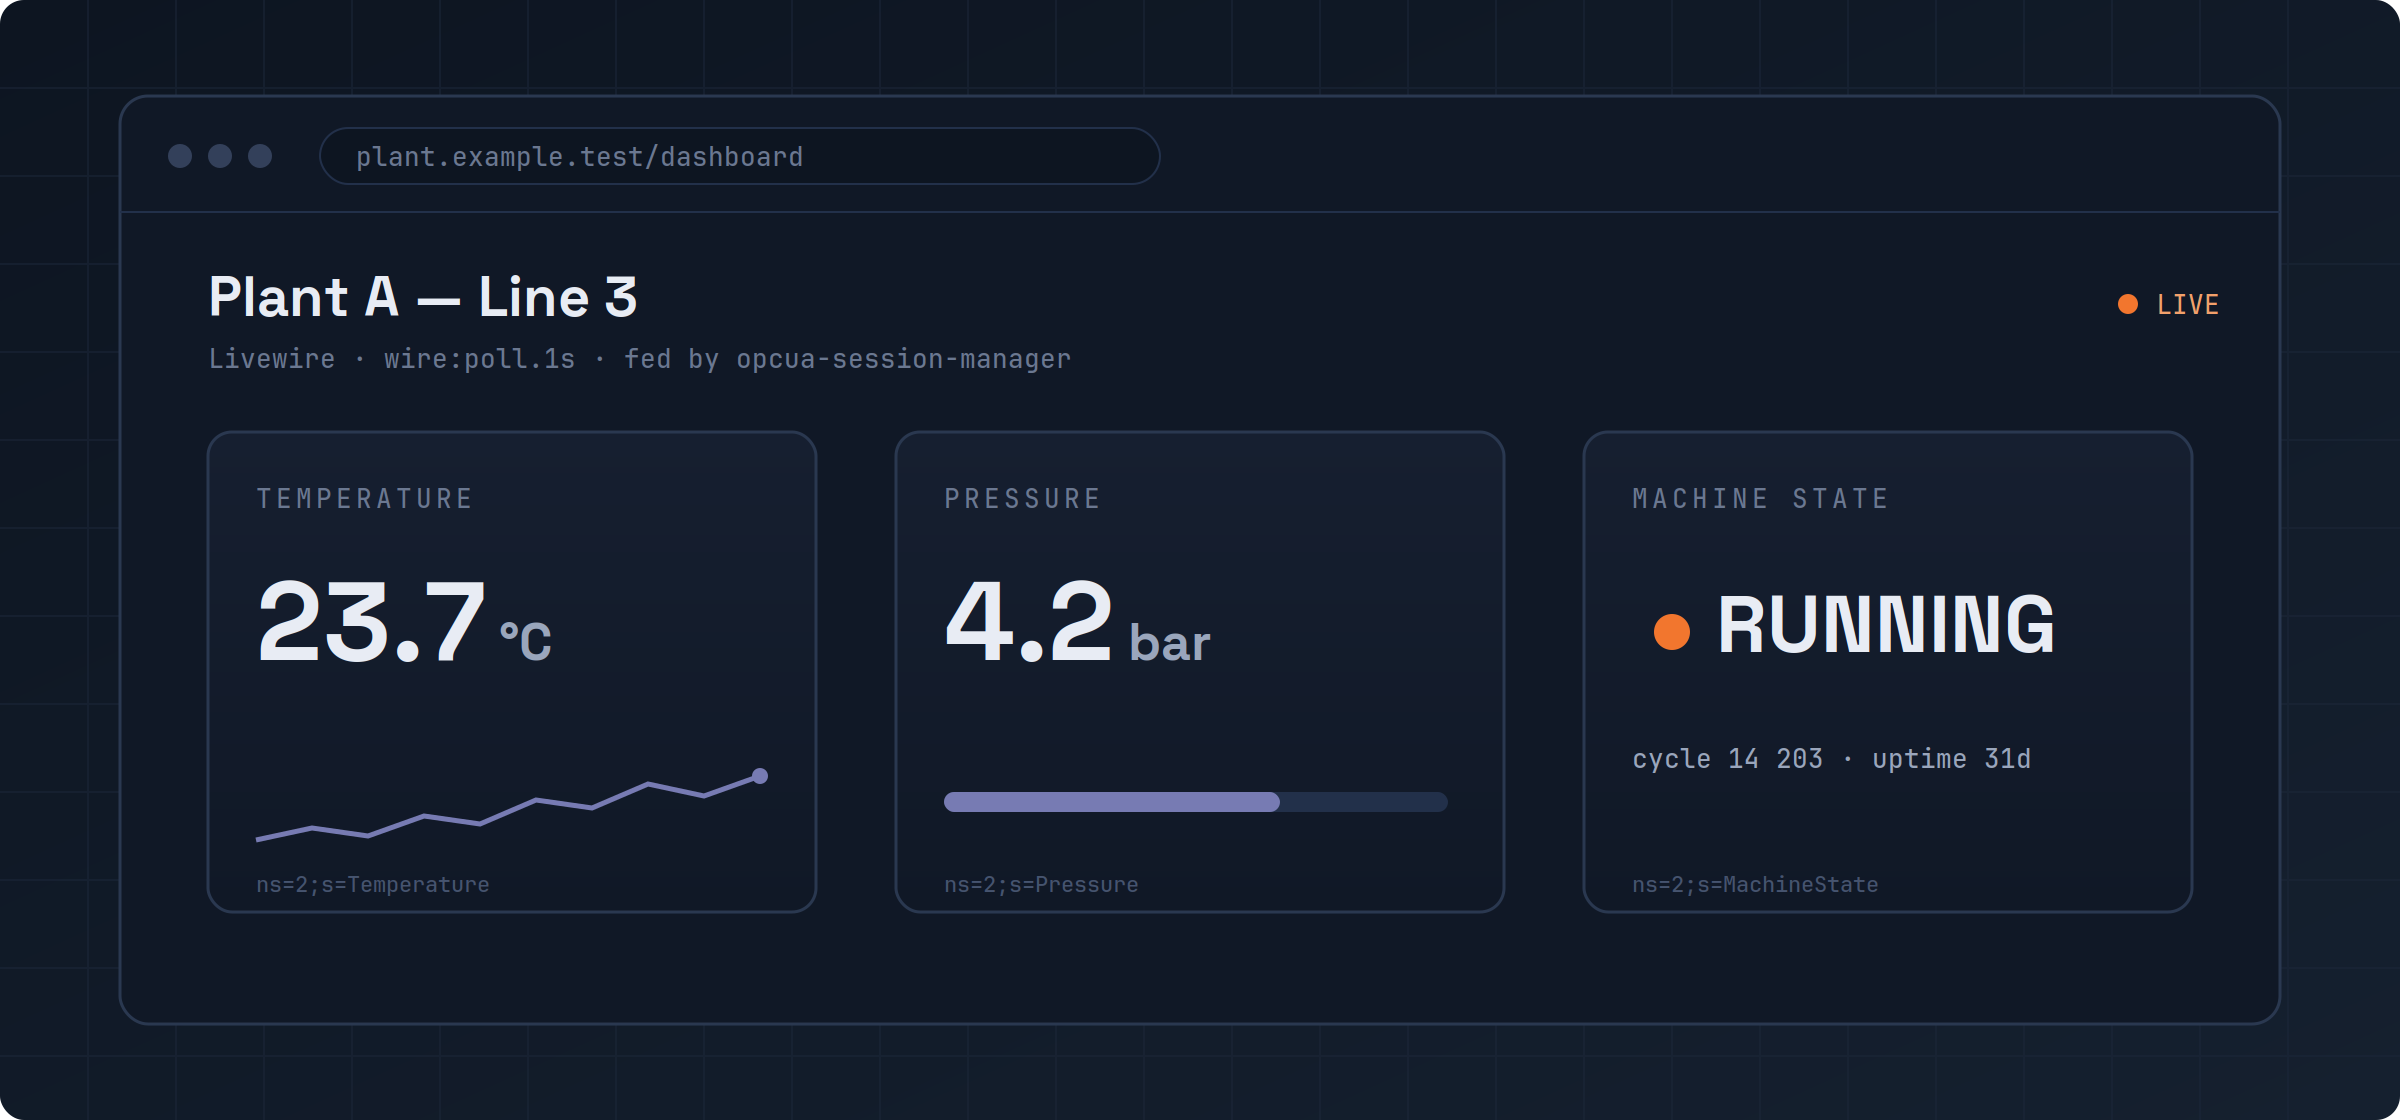
The interesting part isn't the UI — it's how the data gets there without violating PHP's request model.
Why a daemon holds your session
OPC UA subscriptions are stateful: the server keeps your subscription alive and pushes notifications over the open session. A classic PHP-FPM request lives for milliseconds and then dies — taking any session with it. Reconnecting on every request would mean a full handshake each time (~150 ms) and no way to receive pushed data at all.
opcua-session-manager solves this with a small ReactPHP daemon that owns the OPC UA session and the subscriptions. Your short-lived PHP processes talk to it over local IPC (~5 ms), and the daemon talks to the plant. In managed mode with auto-publish enabled, the daemon also drives the publish loop and dispatches every notification as a PSR-14 event straight into Laravel's event dispatcher — your listeners receive DataChangeReceived like any other Laravel event.
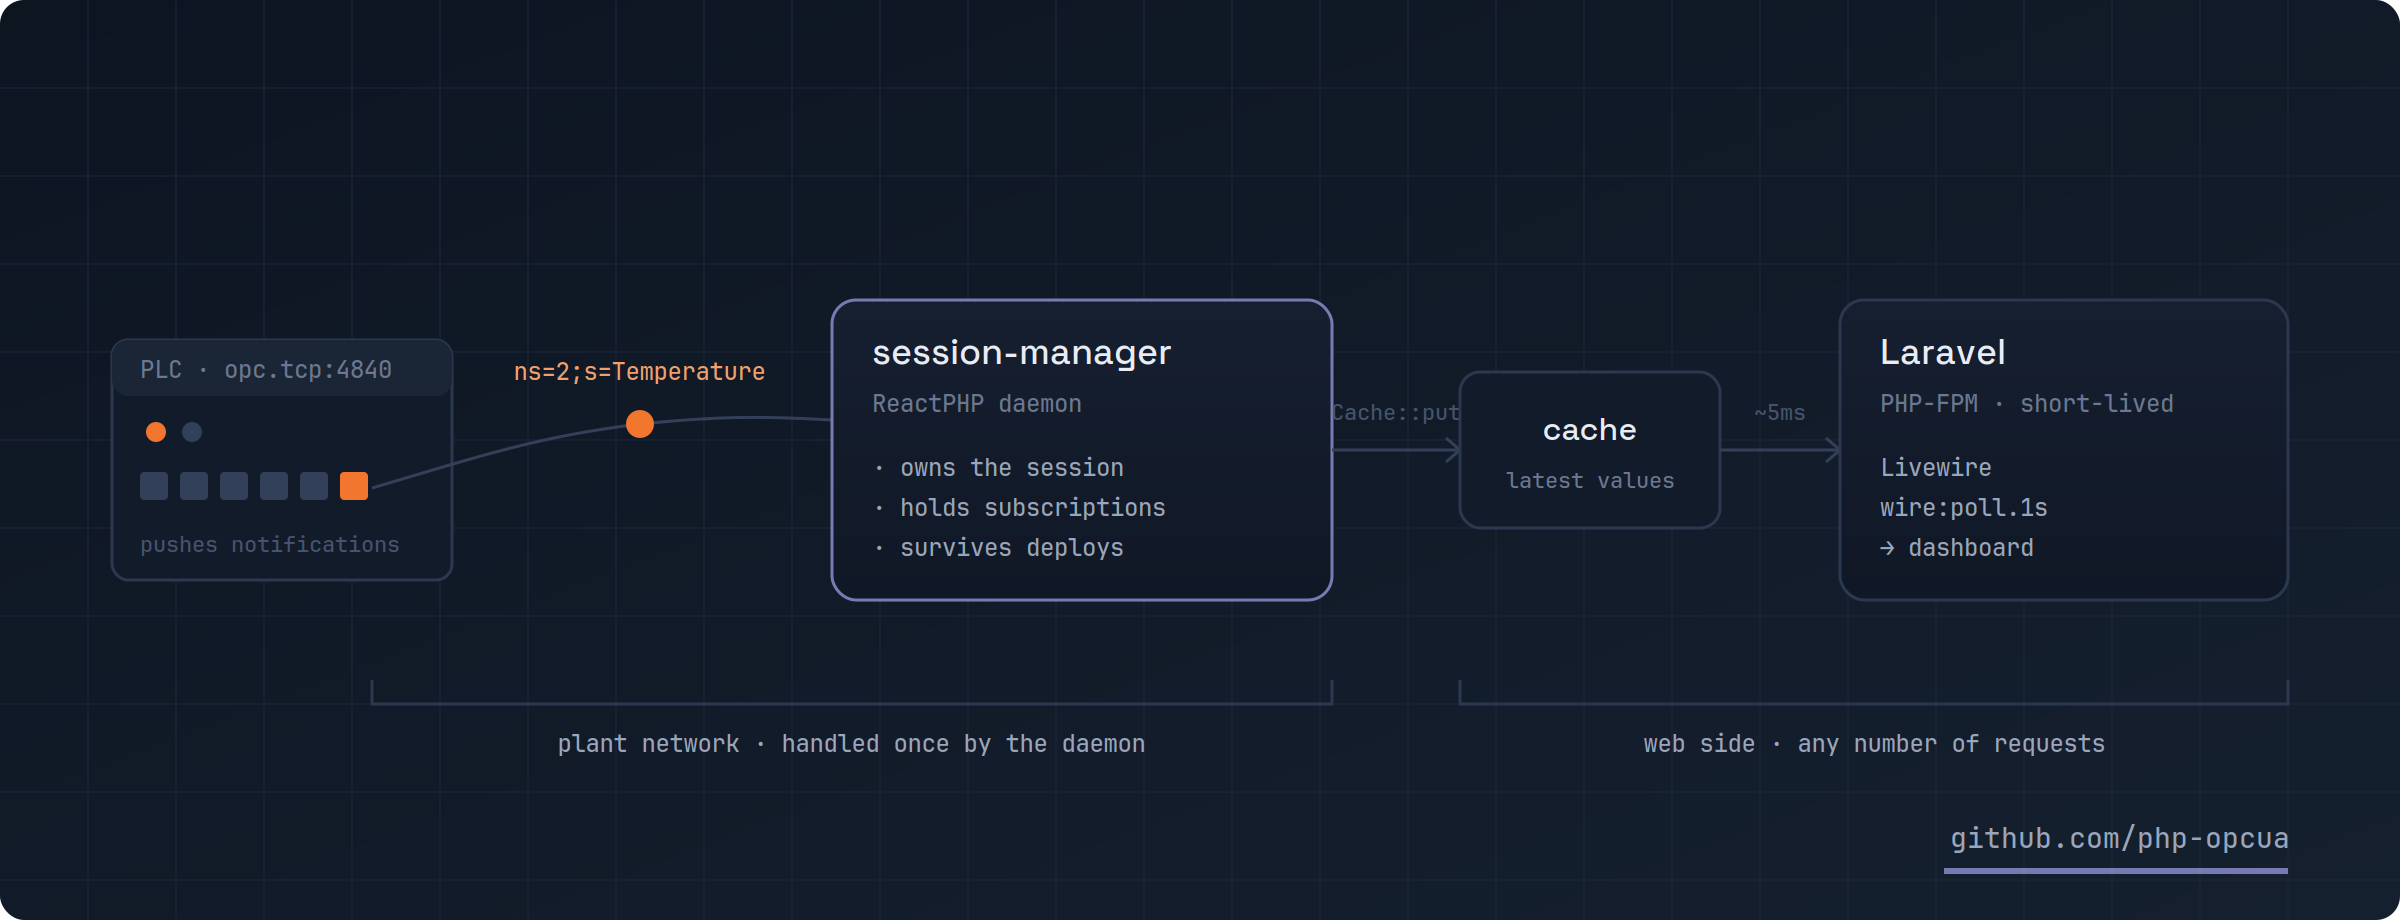
One daemon, one session, any number of web requests reading the result.
Setting up the project
-
01
Install the Laravel integration
It pulls in the core client; the session manager ships as its own package.
composer require php-opcua/laravel-opcua php-opcua/opcua-session-manager -
02
Configure the connection
Publish
config/opcua.php, point the connection at your endpoint via.env, and enableauto_publishunder thesession_managerkey (OPCUA_AUTO_PUBLISH=true) so the daemon drives the publish loop for you. We'll add the subscriptions to this same file in a moment.php artisan vendor:publish --tag=opcua-config# .env OPCUA_ENDPOINT=opc.tcp://192.168.1.10:4840 -
03
Start the session manager
The integration ships an Artisan command for the daemon. In development a separate terminal is fine; in production run it under systemd or Supervisor.
php artisan opcua:session
Subscribing to live values
There's no callback-style subscribe() helper — the package surfaces the real OPC UA service set: subscriptions and monitored items. And for a dashboard like ours, you don't even need to write the code that creates them: declare everything in config/opcua.php, and the daemon sets it up by itself.
'connections' => [
    'default' => [
        'endpoint' => env('OPCUA_ENDPOINT'),

        // The daemon connects on boot and creates these for you
        // (requires session_manager.auto_publish = true)
        'auto_connect'  => true,
        'subscriptions' => [
            [
                'publishing_interval' => 500.0, // float, ms
                'monitored_items' => [
                    ['node_id' => 'ns=2;s=Temperature',  'client_handle' => 1],
                    ['node_id' => 'ns=2;s=Pressure',     'client_handle' => 2],
                    ['node_id' => 'ns=2;s=MachineState', 'client_handle' => 3],
                ],
            ],
        ],
    ],
],
This buys you something subtle and valuable: subscriptions normally die when the daemon restarts and the application has to re-create them. With auto_connect + subscriptions in config, the daemon re-establishes everything on its own boot — the dashboard recovers from a daemon restart with zero application code.
(Prefer doing it imperatively? The same thing is three calls — createSubscription(), createMonitoredItems()->add(...)->execute() — from any command or controller; in managed mode the code can exit immediately and the daemon keeps the subscription alive. See the subscriptions docs for both styles.)
Each notification now arrives as a DataChangeReceived event in Laravel's dispatcher. One listener mirrors the latest value into the cache, keyed by the client handle we chose above:
namespace App\Listeners;

use Illuminate\Support\Facades\Cache;
use PhpOpcua\Client\Event\DataChangeReceived;

class CacheLatestPlantValue
{
    private const KEYS = [
        1 => 'plant-a:temperature',
        2 => 'plant-a:pressure',
        3 => 'plant-a:machine-state',
    ];

    public function handle(DataChangeReceived $event): void
    {
        $key = self::KEYS[$event->clientHandle] ?? null;

        if ($key !== null) {
            Cache::put($key, $event->dataValue->getValue());
        }

        Cache::put('plant-a:last-seen', now());
    }
}
Register it in your EventServiceProvider like any other listener (or with #[AsEventListener] on Laravel 11+). Because the daemon owns the session — and recreates the config-declared subscriptions on its own boot — the pipeline survives HTTP requests, worker restarts, application redeploys and daemon restarts.
Showing it on screen
The Livewire component never talks OPC UA — it reads three cache keys and re-renders every second:
namespace App\Livewire;

use Illuminate\Support\Facades\Cache;
use Livewire\Component;

class PlantDashboard extends Component
{
    public function render()
    {
        $lastSeen = Cache::get('plant-a:last-seen');

        return view('livewire.plant-dashboard', [
            'temperature' => Cache::get('plant-a:temperature'),
            'pressure'    => Cache::get('plant-a:pressure'),
            'state'       => Cache::get('plant-a:machine-state'),
            'isLive'      => Cache::get('plant-a:online', false)
                             && $lastSeen?->diffInSeconds() < 5,
        ]);
    }
}<div wire:poll.1s>
<x-live-badge :live="$isLive" /> {{-- ● LIVE / ● OFFLINE --}}
<div class="grid grid-cols-3 gap-4">
<x-stat-card label="Temperature" :value="$temperature" unit="°C" />
<x-stat-card label="Pressure" :value="$pressure" unit="bar" />
<x-stat-card label="Machine state" :value="$state" />
</div>
</div>Polling the local cache once per second costs essentially nothing — the expensive part, the plant network, is handled once by the daemon regardless of how many browsers are watching.
The LIVE badge: don't trust a frozen number
A dashboard that keeps showing the last good value while the PLC is unreachable is worse than no dashboard. The LIVE badge answers two separate questions, and it takes both to light up green:
Is the connection up? The client dispatches connection lifecycle events — ClientConnected, ClientDisconnected, ConnectionFailed — through Laravel's dispatcher like everything else. One small listener tracks the state:
namespace App\Listeners;

use Illuminate\Support\Facades\Cache;
use PhpOpcua\Client\Event\ClientConnected;
use PhpOpcua\Client\Event\ClientDisconnected;
use PhpOpcua\Client\Event\ConnectionFailed;

class TrackPlantConnection
{
    public function handle(
        ClientConnected|ClientDisconnected|ConnectionFailed $event,
    ): void {
        Cache::put('plant-a:online', $event instanceof ClientConnected);
    }
}
Is the data fresh? A connection can be up while no data flows — a misconfigured node, a PLC that stopped publishing, a subscription torn down by hand. That's why CacheLatestPlantValue also stamps plant-a:last-seen on every notification — the heartbeat. The badge is green only when the connection is up and the last notification is younger than a few seconds (pick a threshold of roughly 2–3× your publishing interval; ours is 500 ms, so 5 s is comfortable).
A nice property of this setup: when the connection drops and comes back, ClientConnected fires again on the successful reconnect — there is no separate "reconnected" event — so the badge recovers on its own, no extra code.
Going further
The connection events docs show richer patterns built on the same events: a connection audit table, a multi-PLC status tile keyed by endpoint, and a flap detector that counts ClientReconnecting events to spot unstable links.
Production notes
Before the plant network
The example connects with the simplest settings for clarity. On a real line: pick one of the 10 security policies and configure certificates, run the daemon under a process supervisor, and tune per-item monitoring: a deadband matched to the engineering tolerance keeps high-frequency analog tags from flooding the wire with noise, and MachineState rarely needs the same samplingInterval as a fast analog value. For listeners that do real work (DB writes, broadcasts), make them queued listeners.
Subscriptions also carry quality and timestamps with every notification — surface them in the UI when a sensor goes stale instead of silently showing the last good value. Your operators will thank you.
Want to go further? The docs ship an end-to-end Livewire real-time dashboard recipe with broadcasting instead of polling, and the full ecosystem — CLI, typed companion-spec classes, transport extensions — is on the Discover page. If you build something on a real line with this, we'd genuinely love to hear how it went: github.com/php-opcua.
Example
You can find the complete example at the following link github: live-machine-dashboard
Keep reading
OPC UA Security in PHP: Policies, Certificates, and Trust
Ten security policies, three trust modes, and the certificate flow between php-opcua and your PLC — from wide-open defaults to production-ready.
OPC UA sessions vs HTTP API calls, explained for PHP devs
OPC UA sessions vs HTTP API calls, explained for PHP devs
OPC UA in Pure PHP: Introducing the php-opcua Project
php-opcua brings the OPC UA binary protocol to pure PHP: client, CLI and Laravel integration, no C extensions. Read your first PLC value in minutes.